
What it does.
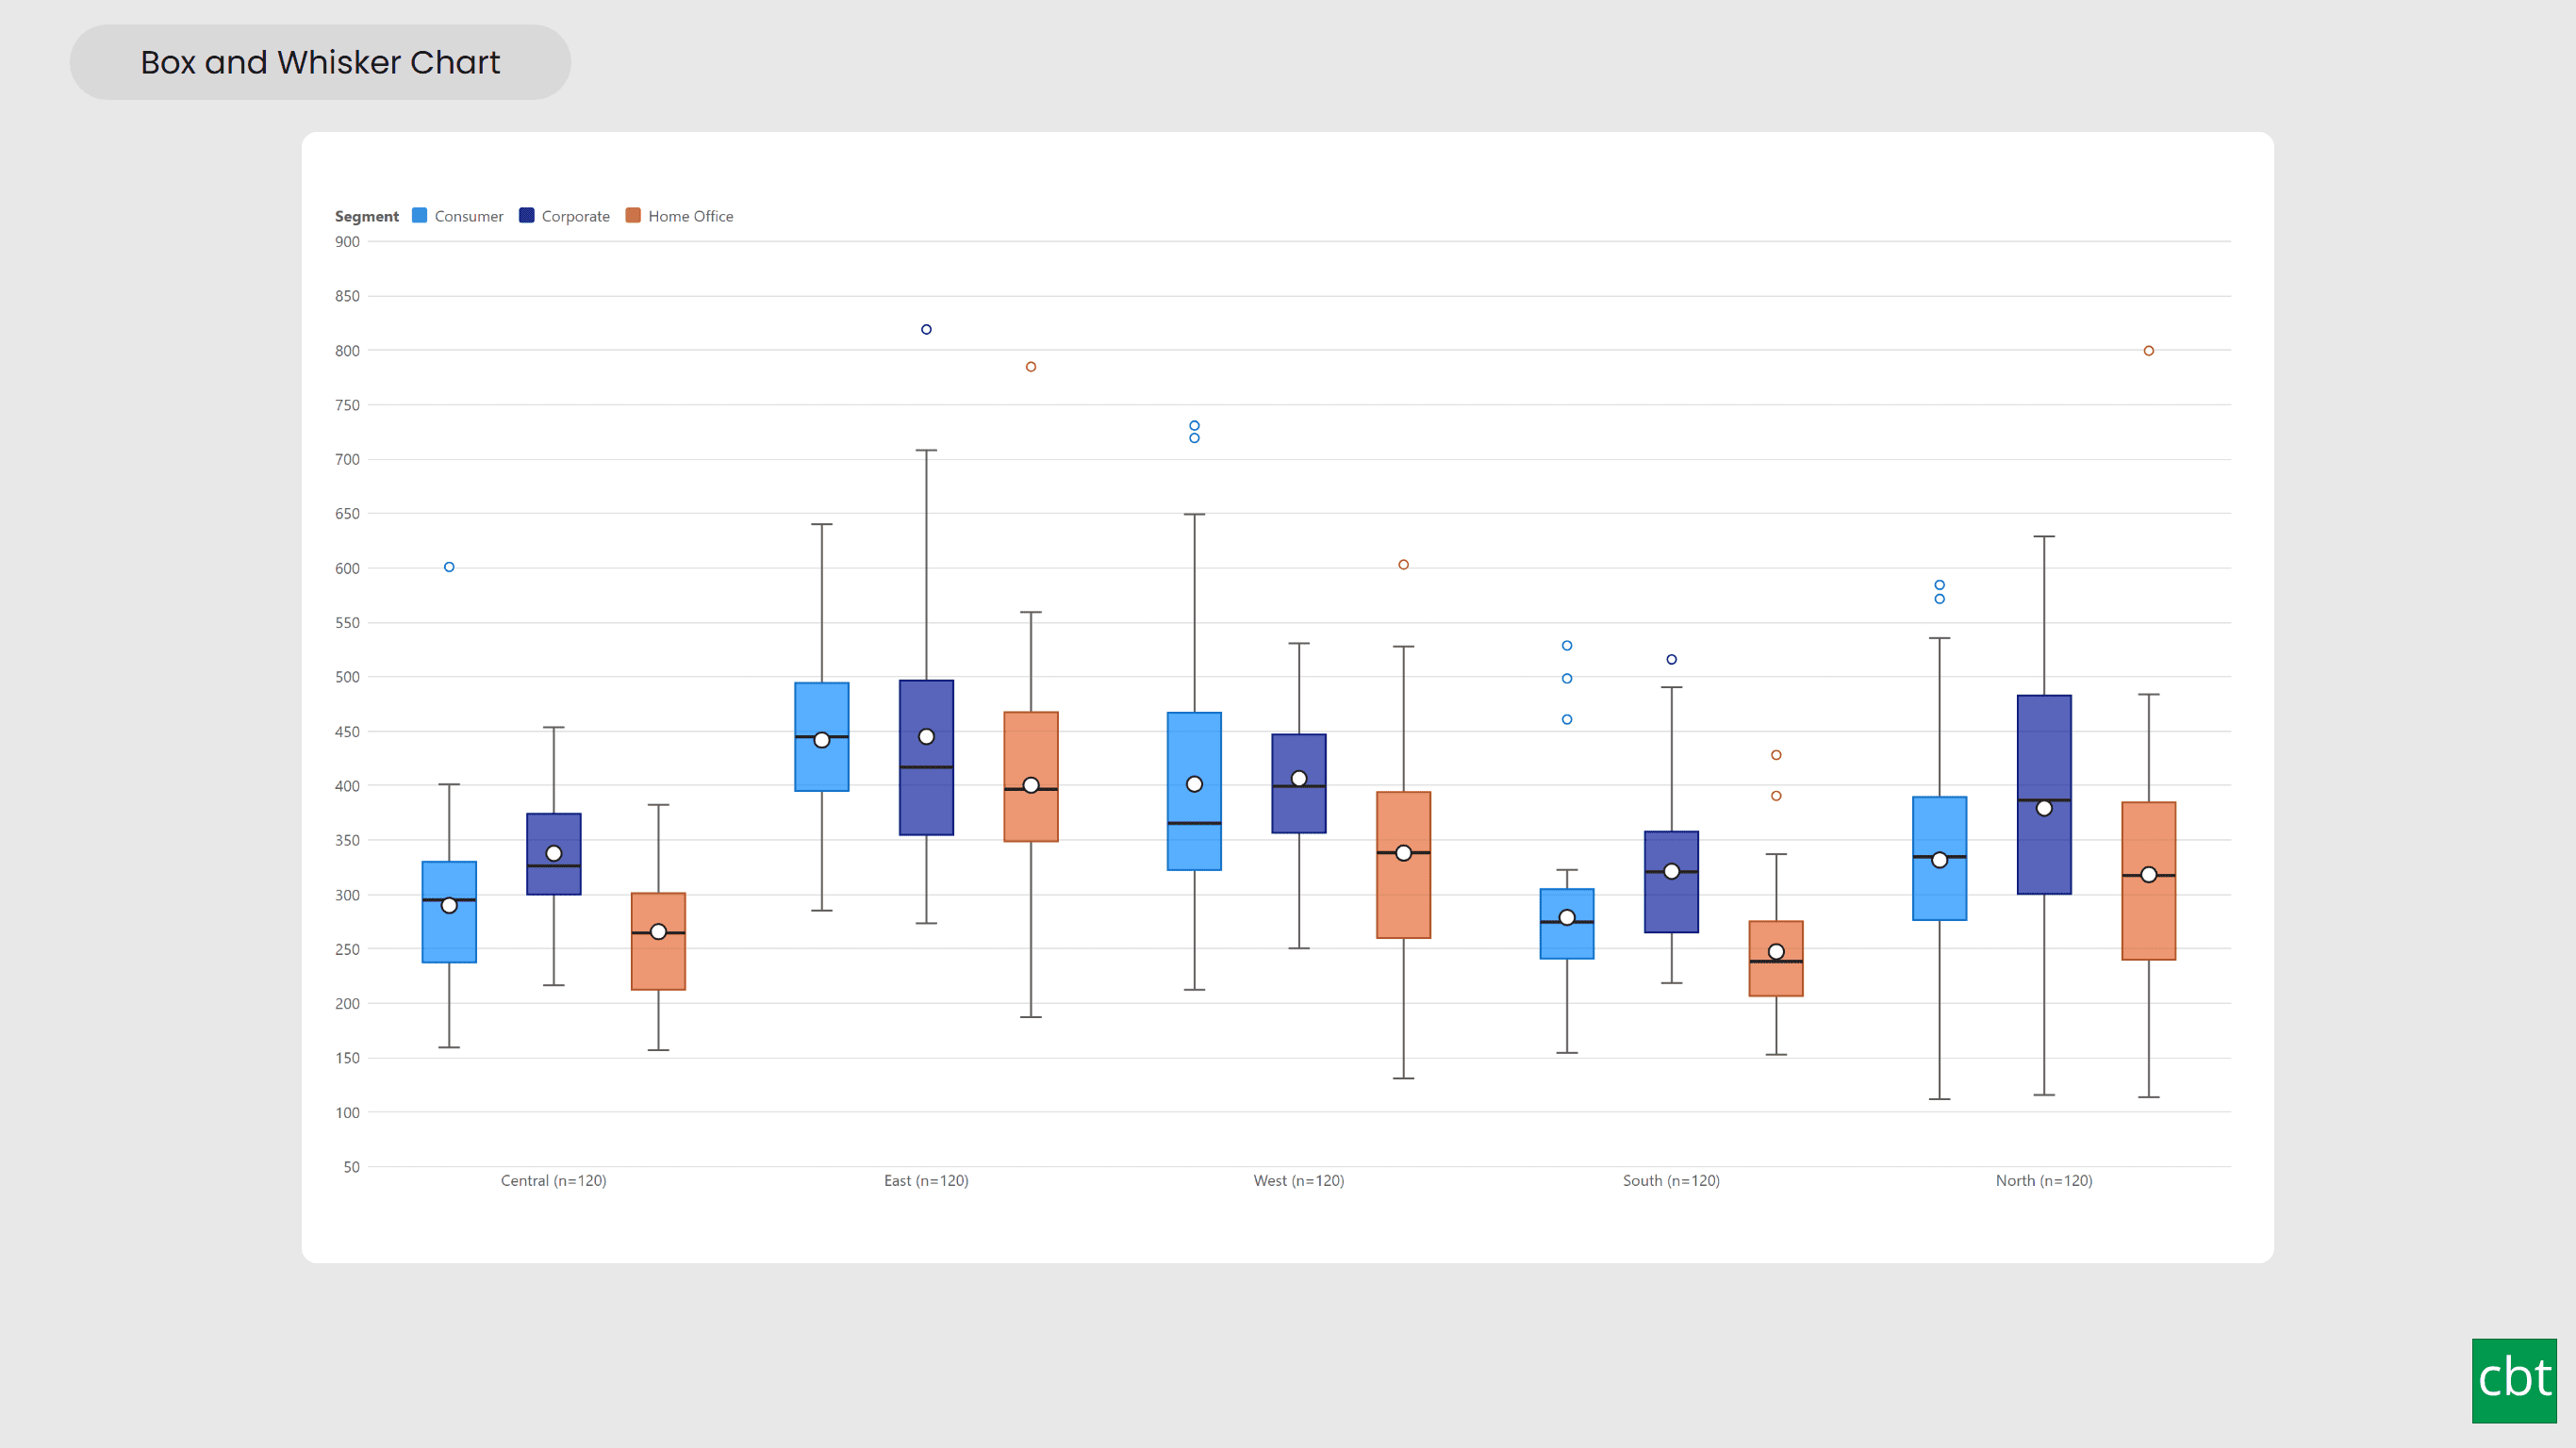
An average hides most of the story. Two regions can share the same mean while one is steady and the other swings from tiny orders to huge ones. A box and whisker chart shows the whole distribution at once, so a reader sees the typical value, how far values spread and which ones stand out.
Every category shows a box from the first to the third quartile with a line at the median, whiskers reaching to the typical range, and the points beyond them marked as outliers. A tall box means values vary widely; a short one means they are consistent. When the boxes of two groups barely overlap, the difference between them is likely real.
The visual works from raw rows. Add a Value and a Sampling field that identifies each observation, such as Order ID, and it calculates every statistic itself, with four quartile methods to match Excel or your statistics tool and four whisker types, from Tukey's 1.5 × IQR to custom percentiles or mean ± standard deviation. It handles small groups and single values, and posts a short notice when a field is missing or only part of the data is loaded.
Target measures can be drawn as reference lines per box or across the whole chart, and they follow every filter and slicer. Power BI has no native box plot; this is a standalone visual with the statistics built in, grouped boxes, small multiples, drill-down, cross-filtering from boxes, points and labels, and number formats read straight from the data model.
Use Cases • Compare order values, delivery times or prices across regions, products or teams • Spot outliers and unusual transactions at a glance • Check process or quality measurements against a target or tolerance • Compare salaries, scores or survey ratings by department or group • Show how spread changes over time with a date as the category • Teach and explain distributions with every point visible
What ships today, what’s next.
Available now16 capabilities
- Box plots calculated from raw rows, no DAX
- Four quartile methods (Inclusive, Exclusive, Include / Exclude median)
- Tukey, Min / Max, percentile or mean ± SD whiskers
- Outliers and extreme outliers with their own colours and shapes
- Notches and mean marker
- Outliers only or all points, random jitter or beeswarm
- Grouped boxes with legend and small multiples
- Reference lines from measures (per box or whole chart) and static lines
- Statistic labels, outlier labels and count (n) labels
- Classic, Filled, Minimal and Bold style presets
- Horizontal or vertical, sorting, logarithmic scale and full axis control
- Rich tooltips with a choice of statistics
- Drill down and up with multiple category fields
- Selection, cross-highlighting, bookmarks, context menu, keyboard navigation
- High-contrast mode and colour-blind safe palette
- Landing page quick-start guidance
On the roadmap1 planned
- Dynamic format strings
Other custom visuals.
28 more visuals in the catalogue. All free to download.
Lollipop Chart
Compare one value across many categories with clean stems and markers on a shared scale, and track each category against its target.
Learn more →Scatter Plot with Trendlines
A scatter chart for Power BI with real regression built in. Fit a linear, polynomial, logarithmic, exponential, power, LOESS or moving-average trend, per legend series, with the equation, R² and a confidence band.
Learn more →Correlation Matrix
A correlation matrix that computes its own coefficients. Pearson or Spearman, a p-value and a sample size per cell, clustered ordering, and a scatter one click away.
Learn more →Error Bar
A dot-and-whisker chart for Power BI. Each point shows its value with a whisker for the uncertainty, give it bounds, or hand it raw rows and it computes the confidence interval itself.
Learn more →Connected Scatter Plot
It plots two measures against each other and joins the points in time order, so the path, its direction and its turning points are visible at a glance, by group or in small multiples.
Learn more →Waffle Chart
Show part-to-whole proportions, track progress toward targets, or break totals by category.
Learn more →Win Loss Chart
A win/loss sparkline for Power BI. Each period is one equal-sized mark above or below a baseline, so streaks and form are visible at a glance across many rows at once.
Learn more →Pareto Chart
Sort causes largest first, accumulate them, and mark the vital few that reach your threshold.
Learn more →Radial Histogram
Interactive radial histogram, wedges radiating from a center point, area-correct by default.
Learn more →Advanced Gantt Chart
Interactive Gantt chart for visualizing hierarchical project schedules, with automatic parent task rollups, dual baseline and actual timeline bars, and rule-based conditional formatting.
Learn more →Histogram
Interactive histogram for visualizing the distribution of a continuous measure, with flexible binning, weighted bin heights, and built in statistical overlays.
Learn more →Dual Hierarchy Decomposition Tree Pro
DAX-driven KPI tree with dual-axis drill-down, per-KPI colors, icons, and Microsoft-certified Pro features.
Learn more →Advanced Sankey Diagram
Interactive Power BI Sankey diagram for visualizing multi-stage flow data, with automatic node-to-ribbon color gradients and rule-based conditional formatting.
Learn more →Bullet Chart
Compare performance against multiple targets with qualitative bands, variance, and small multiples.
Learn more →Sparkline KPI Card
KPI Card with Sparkline for Power BI that displays KPI values, previous period comparisons, targets, variance, trend indicators, and interactive sparklines in a compact, business-ready visual.
Learn more →Cluster Analysis Chart
A scatter plot that groups points into clusters by similarity using K-Means, DBSCAN, or Hierarchical clustering. Shows centroids, hulls, ellipses, outliers, and dendrograms, with no R or Python.
Learn more →Dual Axis Bar & Column Chart
Plot two measures on independent scales without dropping in a separate combo chart.
Learn more →Dual Hierarchy Decomposition Tree
Up to four KPIs per card across two hierarchy axes, with DAX-driven status colours.
Learn more →Multi KPI Decomposition Tree
Decompose up to five measures per node, with stacked bars on every branch.
Learn more →Arabic Matrix Table
Right-to-left matrix with Arabic labels, hierarchical rows, subtotals and grand totals.
Learn more →Arabic Stacked Bar Chart
RTL-native stacked bars with Arabic number units, small multiples and cross-filtering.
Learn more →Arabic Stacked Column Chart
RTL-native stacked columns matched to the Arabic Bar visual for consistent dashboards.
Learn more →Arabic Waterfall Chart
Sequential value walk for Arabic dashboards — variance, build-up and bridge analyses.
Learn more →Dumbbell Chart
Two markers per category on a shared scale, connected by a line that makes the gap immediately visible.
Learn more →Counts Plot
Visualise data distribution with dots scaled by frequency across category lanes.
Learn more →Jitter Plot
Show every data point with jitter or beeswarm layout for distribution analysis.
Learn more →Auto Single Select Slicer
Smart Power BI slicer with automatic first-value selection — reports never load with an empty filter.
Learn more →AutoSelect Slicer
Smart Power BI slicer with automatic selection across single-select and multi-select scenarios.
Learn more →Need a custom Power BI visual built for your reporting?
Thirty minutes with a senior BI consultant. We’ll walk your report, scope the visual, and tell you whether a build makes sense.