
What it does.
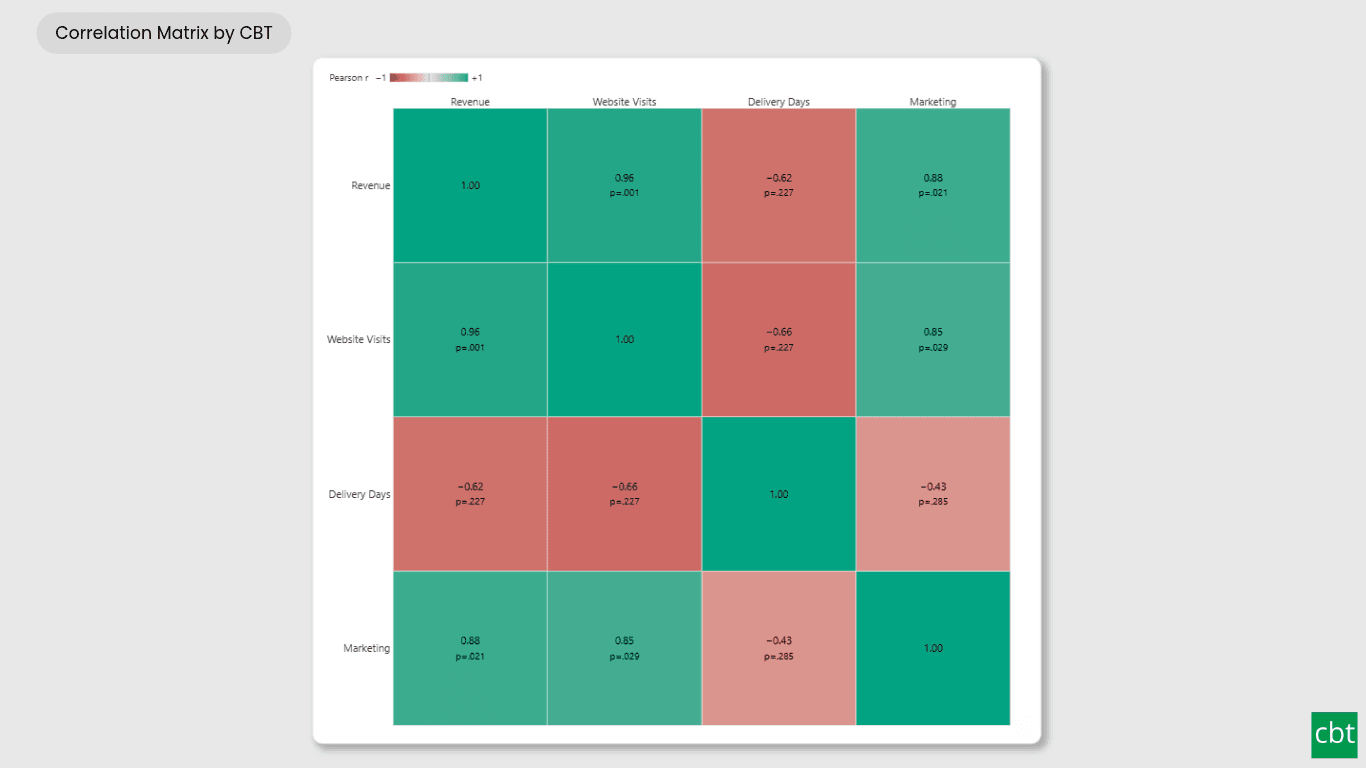
Which of your measures actually move together? A correlation matrix answers it in one screen: every measure against every other, each cell coloured by sign and strength, with the coefficient printed in it.
This visual computes the coefficients itself, in the browser. Every other option in Power BI either needs R installed - which cannot be certified and often fails in the Service - or expects you to produce the matrix in DAX first, which is the hard part.
It also says when not to believe it. Every cell states its own sample size, every pair carries a p-value with optional Holm or Bonferroni adjustment, a notice counts the false positives that many pairs will produce, and the cells too weak or too uncertain to act on can be greyed, hatched or hidden. Click any cell and the scatter of exactly those rows opens inside the visual, because a coefficient is one number summarising a cloud of points.
Use Cases • Which operational drivers move with revenue, out of thirty candidate measures • Which product lines sell together, and which cannibalise each other • Which sensor readings track each other, before building a model • Which survey items are measuring the same underlying thing • Which cost lines rise together, for budget scenario work • Which marketing channels' spend tracks which conversion measures • Any question of the form: which of these measures are worth plotting against each other?
What ships today, what’s next.
Available now21 capabilities
- Pearson and Spearman correlation computed in the visual, no DAX or R
- Two to forty measures in one square matrix
- A p-value per pair, at the significance level you set
- Holm and Bonferroni multiple-comparison adjustment
- A notice counting the false positives this many pairs will produce
- Pairwise or listwise blanks, with n stated per cell
- 95% confidence interval in the tooltip, via the Fisher z transform
- Minimum-n guard for small samples
- Weak and insignificant cells greyed, hatched or hidden
- Clustered, alphabetical, strongest-first or as-bound ordering
- Full matrix, lower or upper triangle, diagonal optional
- Diverging colour fixed from -1 to +1, never rescaled
- Four colour presets including a colour-blind-safe scale, plus custom stops
- Undefined cells shown as an em dash, never as zero
- Click a cell for a scatter of that cell's rows, with a fitted line
- Rank plotting under Spearman
- Small multiples, each computed on its own rows
- Cross-filtering that recomputes every coefficient
- Keyboard navigation and screen-reader accessibility
- High-contrast mode support
- Landing page quick-start guidance
On the roadmap2 planned
- Partial Correlation
- Kendall's tau Correlation
Other custom visuals.
28 more visuals in the catalogue. All free to download.
Lollipop Chart
Compare one value across many categories with clean stems and markers on a shared scale, and track each category against its target.
Learn more →Scatter Plot with Trendlines
A scatter chart for Power BI with real regression built in. Fit a linear, polynomial, logarithmic, exponential, power, LOESS or moving-average trend, per legend series, with the equation, R² and a confidence band.
Learn more →Box and Whisker Chart
A box and whisker chart for Power BI. Hand it row-level data and it computes quartiles, whiskers and outliers for every category, with reference lines, legend groups and full interactivity.
Learn more →Error Bar
A dot-and-whisker chart for Power BI. Each point shows its value with a whisker for the uncertainty, give it bounds, or hand it raw rows and it computes the confidence interval itself.
Learn more →Connected Scatter Plot
It plots two measures against each other and joins the points in time order, so the path, its direction and its turning points are visible at a glance, by group or in small multiples.
Learn more →Waffle Chart
Show part-to-whole proportions, track progress toward targets, or break totals by category.
Learn more →Win Loss Chart
A win/loss sparkline for Power BI. Each period is one equal-sized mark above or below a baseline, so streaks and form are visible at a glance across many rows at once.
Learn more →Pareto Chart
Sort causes largest first, accumulate them, and mark the vital few that reach your threshold.
Learn more →Radial Histogram
Interactive radial histogram, wedges radiating from a center point, area-correct by default.
Learn more →Advanced Gantt Chart
Interactive Gantt chart for visualizing hierarchical project schedules, with automatic parent task rollups, dual baseline and actual timeline bars, and rule-based conditional formatting.
Learn more →Histogram
Interactive histogram for visualizing the distribution of a continuous measure, with flexible binning, weighted bin heights, and built in statistical overlays.
Learn more →Dual Hierarchy Decomposition Tree Pro
DAX-driven KPI tree with dual-axis drill-down, per-KPI colors, icons, and Microsoft-certified Pro features.
Learn more →Advanced Sankey Diagram
Interactive Power BI Sankey diagram for visualizing multi-stage flow data, with automatic node-to-ribbon color gradients and rule-based conditional formatting.
Learn more →Bullet Chart
Compare performance against multiple targets with qualitative bands, variance, and small multiples.
Learn more →Sparkline KPI Card
KPI Card with Sparkline for Power BI that displays KPI values, previous period comparisons, targets, variance, trend indicators, and interactive sparklines in a compact, business-ready visual.
Learn more →Cluster Analysis Chart
A scatter plot that groups points into clusters by similarity using K-Means, DBSCAN, or Hierarchical clustering. Shows centroids, hulls, ellipses, outliers, and dendrograms, with no R or Python.
Learn more →Dual Axis Bar & Column Chart
Plot two measures on independent scales without dropping in a separate combo chart.
Learn more →Dual Hierarchy Decomposition Tree
Up to four KPIs per card across two hierarchy axes, with DAX-driven status colours.
Learn more →Multi KPI Decomposition Tree
Decompose up to five measures per node, with stacked bars on every branch.
Learn more →Arabic Matrix Table
Right-to-left matrix with Arabic labels, hierarchical rows, subtotals and grand totals.
Learn more →Arabic Stacked Bar Chart
RTL-native stacked bars with Arabic number units, small multiples and cross-filtering.
Learn more →Arabic Stacked Column Chart
RTL-native stacked columns matched to the Arabic Bar visual for consistent dashboards.
Learn more →Arabic Waterfall Chart
Sequential value walk for Arabic dashboards — variance, build-up and bridge analyses.
Learn more →Dumbbell Chart
Two markers per category on a shared scale, connected by a line that makes the gap immediately visible.
Learn more →Counts Plot
Visualise data distribution with dots scaled by frequency across category lanes.
Learn more →Jitter Plot
Show every data point with jitter or beeswarm layout for distribution analysis.
Learn more →Auto Single Select Slicer
Smart Power BI slicer with automatic first-value selection — reports never load with an empty filter.
Learn more →AutoSelect Slicer
Smart Power BI slicer with automatic selection across single-select and multi-select scenarios.
Learn more →Need a custom Power BI visual built for your reporting?
Thirty minutes with a senior BI consultant. We’ll walk your report, scope the visual, and tell you whether a build makes sense.